YOLOv8 Metrics Explained: Precision, Recall and mAP
What precision, recall, mAP50 and mAP50-95 really mean in YOLOv8, explained with real training results from four of my models, and how to act on them.
By Abrar Ahmad, AI/ML Engineer
You finish training a YOLOv8 model and the console prints four numbers: P, R, mAP50 and mAP50-95. Your model scores 79.6% on one and 54.8% on another. Is that good? Which one should you put in your report? And what should you change if it's too low?
Most explanations stop at the definitions. In this post I explain each metric with real training results from four models I trained with Ultralytics YOLOv8: a number plate detector, an office activity tracker, a plant disease detector and a fire and smoke detector. They are very different tasks, and their numbers tell very different stories.
If you haven't trained a model yet, start with my step-by-step guide: Train YOLOv8 on a Custom Dataset in Google Colab.
The four models in this post
| Model | Task | Classes | YOLOv8 size |
|---|---|---|---|
| Car number plate detection | Find number plates in traffic video | 1 | nano |
| Office activity tracking | Label what each person is doing | 6 | nano |
| Plant disease detection | Identify plant and disease per leaf | 29 | nano |
| Fire & smoke detection | Find flames and smoke in CCTV | 2 | small |
And their final validation results, taken from the metrics Ultralytics saves inside each model's best.pt:
| Model | Precision | Recall | mAP@50 | mAP@50-95 |
|---|---|---|---|---|
| Number plate | 99.1% | 94.7% | 97.9% | 79.8% |
| Office activity | 83.4% | 87.0% | 88.3% | 74.4% |
| Plant disease | 79.6% | 72.9% | 79.6% | 54.8% |
| Fire & smoke | 67.8% | 63.8% | 71.0% | 47.0% |
Keep this table in mind. By the end of the post, you'll be able to read it like a diagnosis.
Where these numbers come from
Every number in this post is measured on the validation split: the images listed under val: in your data.yaml, which the model never trains on. After each epoch, Ultralytics runs the model on those images, compares its boxes with the labels and logs the results to runs/detect/train/results.csv.
You'll see the metrics written as metrics/precision(B) or metrics/mAP50-95(B). The (B) means box. Segmentation models also log a second set marked (M) for mask, measured on the pixel masks instead of the boxes.
IoU: how YOLO decides a box is "correct"
Every metric depends on one question: did the predicted box land on the object? YOLO answers it with IoU, Intersection over Union:
IoU = area where the two boxes overlap / area covered by both boxes together
- IoU = 1.0: the predicted box matches the labelled box exactly.
- IoU = 0.5: they overlap by about half.
- IoU = 0: they don't touch.
A prediction counts as a true positive if it has the right class and its IoU with a labelled box is above a threshold. Everything else is a false positive. A labelled object that no prediction matched is a false negative, a miss.
Hold on to the threshold: it's the whole difference between mAP50 and mAP50-95.
Precision: when the model says "plate", is it right?
Precision = true positives / everything the model detected
Precision answers: of the boxes the model drew, how many were real objects? Low precision means false alarms: boxes on things that aren't there.
My number plate model has 99.1% precision: almost every box it draws is a real plate. That matters, because in a number plate recognition system every false box triggers an OCR read and can create a wrong record.
Recall: of the real objects, how many did it find?
Recall = true positives / all objects in the labels
Recall answers: of everything that was really there, how much did the model find? Low recall means misses.
The same number plate model has 94.7% recall: it finds about 95 of every 100 plates. Very good, but notice it's lower than its precision. The model is slightly conservative: it would rather skip a plate than draw a wrong box.
Precision and recall pull against each other
Each detection comes with a confidence score, and the threshold you choose moves the balance. A high threshold keeps only confident boxes: precision goes up, recall goes down. A low threshold catches more objects, along with more false alarms.
One detail that confuses many people: the P and R that Ultralytics prints are not measured at your conf=0.5. They're reported at the confidence threshold that gives the best F1 score (the balance of precision and recall) on the validation set. In deployment you pick your own threshold, so your real-world precision and recall will be different. Use the printed P and R to compare models, and the precision-recall and F1 curves in the run folder to choose your threshold.
A real example: a model that was too cautious
My fire and smoke detector is the clearest example of precision and recall telling different stories.
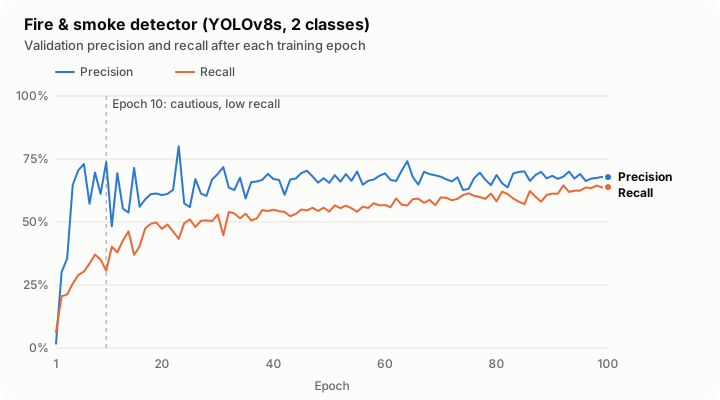
Precision and recall of my fire and smoke model after every epoch of training.
At epoch 10, precision was 73.8% but recall only 30.7%. Precision even peaked at 80.0% at epoch 23, while recall was just 43.3%. If you only looked at precision, you'd think the model was nearly done. It wasn't: it only fired on the most obvious flames and missed most of the fire and smoke in the images.
From epoch 10 to epoch 100, recall more than doubled, from 30.7% to 63.8%, while precision settled in the 60s. The final model is less precise than at epoch 23, and far more useful, because it actually finds the fire. A fire alarm that misses most fires is worse than one with a few false alarms you can filter out.
The lesson: never judge a model on precision alone, or recall alone. Look at both, and decide which mistake costs more in your application.
AP and mAP: one number for the whole curve
Since precision and recall depend on the threshold, we want one number that covers every threshold. That's Average Precision (AP): sort all detections by confidence, trace precision against recall, and measure the area under that curve. A perfect model scores 1.0 (100%).
AP is calculated per class. mAP, mean Average Precision, is the average across all classes. For my 29-class plant model, mAP is the average of 29 separate AP scores, so a few weak classes can pull the total down even if most classes are good.
mAP50 vs mAP50-95: the difference that matters most
- mAP@50 (also written mAP50 or mAP@0.5) counts a detection as correct if its IoU is at least 0.5. It asks: did the model find the object?
- mAP@50-95 calculates mAP at ten IoU thresholds, 0.50, 0.55, 0.60 … 0.95, and averages them. At 0.95, the box has to be almost pixel-perfect. It asks: how precisely did the model outline the object?
That's why mAP@50-95 is always lower than mAP@50, and why the gap between them is so informative. Here is how both developed while training my number plate model:
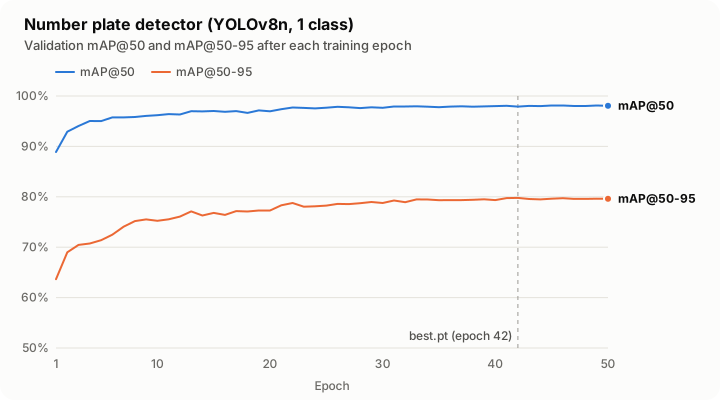
mAP@50 and mAP@50-95 of my number plate model after every epoch.
Two things stand out:
- mAP@50 was high almost immediately. Thanks to the pretrained weights, the model hit 88.9% after a single epoch and was close to its final level by epoch 20. Finding plates was easy.
- mAP@50-95 kept climbing long after mAP@50 had flattened, from 77.3% at epoch 20 to 79.8% at its best. The later epochs weren't teaching the model to find more plates; they were teaching it to draw tighter boxes. For a plate that gets cropped and passed to OCR, that is exactly the improvement you want.
The gap tells you how well-defined your objects are
Now look at the gap between mAP@50 and mAP@50-95 across all four models:
| Model | mAP@50 | mAP@50-95 | Gap |
|---|---|---|---|
| Office activity | 88.3% | 74.4% | 13.9 points |
| Number plate | 97.9% | 79.8% | 18.1 points |
| Fire & smoke | 71.0% | 47.0% | 24.0 points |
| Plant disease | 79.6% | 54.8% | 24.8 points |
People and number plates have clear edges: everyone would draw roughly the same box around them, so the model can match the labels closely and the gap stays small.
Smoke has no edges at all. Where does a cloud of smoke end? Two people labelling the same image would draw different boxes, so even a perfect model can't hit IoU 0.95 consistently. Leaves in the plant dataset overlap, curl and fade into the background, which creates the same problem.
So a low mAP@50-95 is not always the model's fault. When the gap is large, check your labels before you blame the model.
Why more classes means lower numbers
My plant disease model has the lowest mAP@50 of the three nano models, 79.6%, and it's arguably the most impressive. It has to tell apart 29 classes, many of which look almost identical: tomato early blight vs tomato late blight vs tomato septoria leaf spot. The number plate model has one class and nothing to confuse it with.
Never compare mAP across different datasets as if it were the same test. 79.6% on 29 look-alike classes and 97.9% on one distinctive class are both good results.
Reading the training curve: is the model done?
The curves above answer another important question: should you train longer?
- The curve has flattened (number plate, after about epoch 40): more epochs won't help much. Improve the data or try a bigger model instead.
- The curve is still rising at the last epoch (plant disease and fire & smoke both had their best mAP@50-95 at their final epoch, 70 and 100): the run ended too early. Train longer.
- Training loss keeps falling but validation loss starts rising: the model is memorising the training images (overfitting). Stop earlier, add more data or augmentation.
Which epoch does best.pt come from?
Ultralytics saves the epoch with the best fitness score as best.pt. In all four of my runs, the fitness value stored in best.pt is exactly the mAP@50-95 score, so best.pt is the epoch with the highest mAP@50-95. For the number plate model that was epoch 42 of 50, which is why its final best.pt numbers (97.9% mAP@50) are slightly different from the last epoch's (98.1%).
You can find the best epoch yourself from results.csv:
import pandas as pd

df = pd.read_csv("runs/detect/train/results.csv")
df.columns = df.columns.str.strip()  # older versions pad the column names with spaces

best = df.loc[df["metrics/mAP50-95(B)"].idxmax()]
print(best[["epoch", "metrics/precision(B)", "metrics/recall(B)",
            "metrics/mAP50(B)", "metrics/mAP50-95(B)"]])
Look at every class, not just the average
For multi-class models, the overall mAP hides your weakest classes. Validate best.pt and print the score per class:
from ultralytics import YOLO

model = YOLO("runs/detect/train/weights/best.pt")
metrics = model.val()

for i, score in enumerate(metrics.box.maps):  # mAP@50-95 per class
    print(f"{model.names[i]:<35} {score:.3f}")
The classes at the bottom of that list tell you exactly where to collect more images.
What to do when a number is low
| Symptom | What it usually means | What to try |
|---|---|---|
| Low precision | False alarms on similar-looking things | Add "hard negative" images with no objects (sunsets and red lights for fire, signs for plates); raise the confidence threshold |
| Low recall | The model misses objects | More and more varied training images; larger imgsz for small objects; lower the confidence threshold |
| High mAP@50, low mAP@50-95 | Finds objects but boxes are loose | Check label consistency; train longer; larger input size |
| Low mAP across the board | The model hasn't learned the task | Check labels and class indices first, then more data, more epochs or a bigger model |
| Best epoch = last epoch | Training stopped too early | Increase epochs |
| One class far below the rest | Too few or confusing examples for it | Collect more images for that class |
Which metric should you report?
There is no single right answer; it depends on what a mistake costs:
- Number plate recognition: the detection is cropped for OCR, so tight boxes matter. Report mAP@50-95 alongside precision.
- Fire and safety alarms: a missed fire is the worst outcome. Report recall, and precision at the threshold you deploy with.
- Counting and analytics (office activity, livestock): missing people skews the totals, so recall matters, while mAP@50 is a fair summary of detection quality.
- Comparing two models on the same dataset: mAP@50-95 is the most complete single number, and it's what COCO benchmarks use.
Whatever you report, say which split it's measured on and at what confidence threshold. "97.9% mAP@50 on the validation set" is a result; "97.9% accuracy" is not.
Cheat sheet
- IoU: how much a predicted box overlaps the real one.
- Precision: of the boxes drawn, how many were right. Low = false alarms.
- Recall: of the real objects, how many were found. Low = misses.
- mAP@50: did the model find the objects?
- mAP@50-95: did it outline them precisely?
- A big gap between the two: fuzzy objects or inconsistent labels.
- Best epoch is the last epoch: train longer.
The full training details behind each model are in the case studies: number plate, office activity, plant disease and fire & smoke detection.
- YOLOv8
- Computer Vision
- Object Detection
- Model Evaluation
- Machine Learning